-
Use Cases
-
Resources
-
Pricing
4000 BC - 1990
Gold artifacts found at the Wadi Qana cave cemetery in the West Bank were identified as the earliest known gold artifacts from the Levant as of 1990. They date to the 4th millennium BC.
Image source: Wadi Qana
2600 BC
Egyptian hieroglyphs from as early as 2600 BC describe gold, demonstrating that the metal was already recognized and recorded in ancient Egypt.
Image source: Gold
1900 BC
The first written reference to gold was recorded around 1900 BC during Egypt’s 12th Dynasty, providing an early documentary record of the metal.
1400 BC
King Tushratta of the Mitanni claimed that gold was “more plentiful than dirt” in Egypt, reflecting the metal’s exceptional abundance and prestige in diplomatic correspondence of the period.
1350 BC
Gold is mentioned in Amarna letters 19 and 26, diplomatic documents dating from around the 14th century BC.
Image source: Amarna letters
1320 BC - 1200 BC
The oldest known map of a gold mine was drawn during Egypt’s 19th Dynasty, dated approximately 1320–1200 BC.
800 BC
The eighth-century BC legend of the Golden Fleece may preserve a memory of using fleeces to trap gold dust from placer deposits in the ancient world.
500 BC - 400 BC
From the 6th or 5th century BC, the Chinese state of Chu circulated the Ying Yuan, a type of square gold coin.
77 AD
The various methods used for gold extraction in the ancient world were described by Pliny the Elder in Naturalis Historia, written toward the end of the first century AD.
Image source: Pliny the Elder
1324
During his hajj to Mecca in 1324, Mansa Musa, ruler of the Mali Empire, passed through Cairo in July with a large caravan. His distribution of gold reportedly depressed its price in Egypt for more than a decade and contributed to high inflation.
Image source: Mansa Musa
1400 - 1800
From the late 15th to the early 19th centuries, European trade in West Africa focused primarily on gold, alongside ivory and enslaved people.
1690
The exploitation of gold in Colonial Brazil began at the end of the 17th century, especially in Minas Gerais, producing major economic, social, and administrative transformations.
1700 - 1850
Historians estimate that between 800 and 1,000 tons of gold were extracted in Brazil during the 18th and early 19th centuries.
1824 - 1900
British efforts to secure control of West African gold deposits helped drive the Anglo-Ashanti wars of the late 19th century, culminating in the annexation of the Ashanti Empire by Britain.
Image source: Anglo-Ashanti wars
1900 - 1934
For a long period, the United States government set the dollar’s value so that one troy ounce of gold equaled $20.67.
Image source: Gold standard
1910
Seventy-five percent of the gold presently accounted for has been extracted since 1910, illustrating the enormous expansion of modern gold mining.
Image source: Gold mining
1934
In 1934, the United States devalued the dollar’s official gold price from $20.67 to $35.00 per troy ounce.
Image source: Gold Reserve Act
1950
Approximately two-thirds of the gold presently accounted for was extracted since 1950, reflecting the scale of postwar mining and industrial production.
1961 - 1968
By 1961, maintaining the official gold price had become difficult. A pool of United States and European banks agreed to intervene in the market to prevent further currency devaluation amid rising gold demand.
Image source: London Gold Pool
Aug 15, 1971
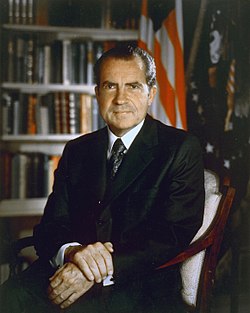
After the 15 August 1971 Nixon shock, the price of gold began to rise sharply as the postwar monetary system moved away from the dollar’s direct convertibility into gold.
Image source: Nixon shock
Jan 21, 1980
Gold reached a high of $850 per troy ounce on 21 January 1980, within the broad price range recorded between 1968 and 2000.
Jun 21, 1999
Gold fell to a low of $252.90 per troy ounce on 21 June 1999, the low point of the 1968–2000 price range.
2001
Gold prices began increasing rapidly from 2001, initiating a long advance that eventually surpassed the previous 1980 high.
Image source: Gold as an investment
2005
The World Gold Council estimated global gold supply at 3,859 tonnes in 2005, compared with demand of 3,754 tonnes, producing a surplus of 105 tonnes.
Jan 3, 2008
On 3 January 2008, gold reached $865.35 per troy ounce, exceeding the nominal high established in 1980.
Mar 17, 2008
Gold set another record on 17 March 2008, reaching $1,023.50 per troy ounce.
Dec 2, 2009
On 2 December 2009, gold reached a new high, closing at $1,217.23 per troy ounce.
May 2010
Gold rallied to new highs in May 2010 as the European Union debt crisis prompted additional purchases of gold as a safe asset.
Image source: European debt crisis
Mar 1, 2011
Gold reached an all-time high of $1,432.57 per troy ounce on 1 March 2011, amid investor concerns about unrest in North Africa and the Middle East.
Aug 23, 2011
From April 2001 to August 2011, spot gold prices more than quintupled against the US dollar. On 23 August 2011, gold reached another record at $1,913.50 per troy ounce, prompting speculation that a long secular bear market had ended.
2014 - 2015
After the 2011 peak, gold prices began a slow decline toward $1,200 per troy ounce in late 2014 and 2015.
Aug 2018 - Oct 2020
Gold gained 59% from August 2018 to October 2020, outperforming the Nasdaq total return, which rose 54% over the same period.
2020
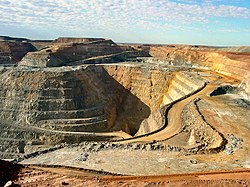
Analysis of the exceptionally rare Yavne collection of 425 gold coins indicated that the coins came from the late 9th century.
Aug 2020
In August 2020, the gold price rose to approximately US$2,060 per ounce after its substantial two-year advance.
Aug 24, 2020
On 24 August 2020, Israeli archaeologists discovered a trove of early Islamic gold coins near the central Israeli city of Yavne.
Or browse the full history timeline directory, with more than 2,500 topics.
This History of Gold timeline was generated with the help of AI, using information found on the internet.
We work hard to keep these timelines accurate, but mistakes do get through. If you spot one, email us at [email protected] and we'll fix it for future visitors.
Generate yours with AI or build it from scratch, for free.
Export your timeline, add your own events, edit or remove AI-generated events, and much more
No credit card required.
Cancel anytime.
Cancel anytime.
You can create an unlimited number of timelines with up to 10 events on each one, customize how they look, export them to PDF, PNG, PowerPoint, CSV, and Excel, and share them with a link. Paid plans raise the event limit and add features like spreadsheet imports and collaborators.
Yes. You can cancel your subscription from your account page at any time, and you will not be charged again. Your subscription stays active for the rest of the period you already paid for.
Yes. We will email you a reminder before the annual renewal, and we will also email you a receipt.
Yes. You can email us within 15 days of any payment, and we will issue you a full refund.
Check out our pricing docs or send us an email anytime: [email protected].