-
Use Cases
-
Resources
-
Pricing
The history of the stock market traces the evolution of organized securities trading from its origins in 17th-century Europe to today's global electronic exchanges. Key milestones include the founding of the Amsterdam Stock Exchange in 1602, the creation of the New York Stock Exchange in 1792, the devastating crashes of 1929 and 1987, and the rise of digital and algorithmic trading in the modern era. More Less
1150
% complete
In 12th-century France, the courtiers de change were concerned with managing and regulating the debts of agricultural communities on behalf of the banks, representing one of the earliest organized financial intermediaries in Europe.
1200
% complete
International traders, and especially Italian bankers, were present in Bruges from the early 13th century. They took back the word 'beurse' to their countries to define the place of a stock market exchange: first the Italians (borsa), but soon also the French (bourse), the Germans (börse), Russians (birža), Czechs (burza), Swedes (börs), Danes and Norwegians (børs).
1250
% complete
In the middle of the 13th century, Venetian bankers began to trade in government securities, marking one of the earliest known markets for sovereign debt instruments.
Image source: Stock exchange
1280
% complete
The Italian historian Lodovico Guicciardini described how, in late 13th-century Bruges, commodity traders gathered outdoors at a market square containing an inn owned by a family called Van der Beurze, laying the groundwork for formalized trading.
1300 - 1400
% complete
Bankers in Pisa, Verona, Genoa and Florence also began trading in government securities during the 14th century, expanding the market for sovereign debt across the Italian peninsula.
1409
% complete
In 1409, traders in Bruges became the 'Brugse Beurse', institutionalizing what had been, until then, an informal meeting of commodity merchants at the Van der Beurse inn.
1500 - 1600
% complete
Companies in England and the Low Countries followed the Italian example in the 16th century, beginning to issue shares of stock to investors, paving the way for modern equity markets.
1351
% complete
In 1351 the Venetian government outlawed spreading rumors intended to lower the price of government funds, an early example of market manipulation regulation.
1934
% complete
Regulation of margin requirements by the Federal Reserve was implemented after the Crash of 1929. In the United States, margin requirements have been 50% for many years—if you want to make a $1000 investment, you need to put up $500, with often a maintenance margin below that.
1986
% complete
In 1986, the CATS trading system was introduced, and the order matching system was fully automated, transforming how exchanges executed trades.
2008
% complete
Events such as the 2008 financial crisis have prompted a heightened degree of scrutiny of the impact of the structure of stock markets (called market microstructure), in particular regarding the stability of the financial system and the transmission of systemic risk.
Feb 1, 2012
% complete
In February 2012, the Investment Industry Regulatory Organization of Canada (IIROC) introduced single-stock circuit breakers to help prevent extreme volatility in individual stocks.
Oct 24, 1929
% complete
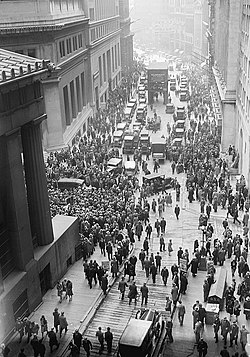
One of the most famous stock market crashes started October 24, 1929, on Black Thursday. The names 'Black Monday' and 'Black Tuesday' are also used for October 28–29, 1929, which followed Terrible Thursday—the starting day of the crash that ushered in the Great Depression.
Image source: Wall Street Crash of 1929
Jan 1, 1973 - Dec 31, 1974
% complete
The stock market crash of 1973–74 was one of a number of famous market crashes, triggered by factors including the oil crisis and economic stagflation, causing prolonged declines across global markets.
Image source: 1973–1974 stock market crash
Oct 19, 1987
% complete
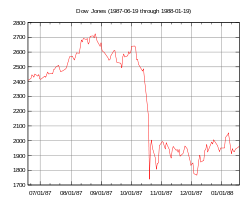
Another famous crash took place on October 19, 1987 – Black Monday – when the Dow Jones Industrial Average plummeted 22.6 percent, the largest-ever one-day fall in the United States. The crash raised puzzles: main news and events did not predict the catastrophe and visible reasons for the collapse were not identified.
Image source: Black Monday (1987)
Mar 10, 2000
% complete
The dot-com bubble of 2000 was among the famous stock market crashes, as overvalued technology and internet companies collapsed, wiping out trillions in market value.
Image source: Dot-com bubble
2007 - 2009
% complete
Starting in 2007 and lasting through 2009, financial markets experienced one of the sharpest declines in decades, tied to the housing collapse and credit crisis.
Image source: 2007–2008 financial crisis
Oct 1, 2007 - Mar 31, 2009
% complete
From October 2007 to March 2009, the S&P 500 fell 57% and wouldn't recover to its 2007 levels until April 2013.
Feb 20, 2020 - Apr 7, 2020
% complete
The 2020 stock market crash was a major and sudden global stock market crash that began on February 20, 2020, and ended on April 7, driven by the onset of the COVID-19 pandemic.
Image source: 2020 stock market crash
Jan 1, 1980 - Dec 31, 1980
% complete
By 1980, the total market capitalization of all publicly traded stocks worldwide stood at US$2.5 trillion, a figure that would grow enormously over the following decades.
Image source: Market capitalization
1992
% complete
Direct ownership of stock by individuals rose slightly from 17.8% in 1992 to 17.9% in 2007, with the median value of these holdings rising from $14,778 to $17,000.
Image source: Stock market
1992 - 2007
% complete
Indirect participation in the form of retirement accounts rose from 39.3% in 1992 to 52.6% in 2007, with the median value of these accounts more than doubling from $22,000 to $45,000 in that time.
2003
% complete
A 2003 paper by Annette Vissing-Jørgensen attempts to explain disproportionate rates of participation along wealth and income groups as a function of fixed costs associated with investing.
2007
% complete
As of 2007, the median value of directly owned stock in the bottom quintile of income is $4,000 while it is $78,600 in the top decile of income, highlighting stark inequality in market participation.
2007 - 2013
% complete
Since the Great Recession of 2008, households in the bottom half of the income distribution have lessened their participation rate both directly and indirectly from 53.2% in 2007 to 48.8% in 2013, while households in the top decile slightly increased participation from 91.7% to 92.1%.
2011
% complete
As of 2011 the national rate of direct participation was 19.6%; for white households the participation rate was 24.5%, for black households it was 6.4%, and for Hispanic households it was 4.3%.
2012 - 2021
% complete
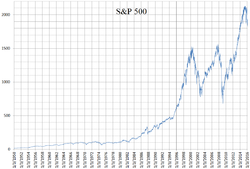
From 2012 to 2021, the S&P 500 index had an average annual return of 14.8%, reflecting a decade of robust market growth.
Image source: S&P 500
2013
% complete
The mean value of direct and indirect holdings at the bottom half of the income distribution moved slightly downward from $53,800 in 2007 to $53,600 in 2013, while the mean value of all stock holdings across the entire income distribution is valued at $269,900 as of 2013.
2016
% complete
As of 2016, there are 60 stock exchanges in the world, providing venues for trading equities across virtually every major economy.
2021
% complete
In 2021, the value of world stock markets increased by 26.5%, reaching US$22.3 trillion in gains amid a strong post-pandemic recovery.
Image source: Stock market
Jan 1, 2022
% complete
By country, the largest stock markets as of January 2022 are in the United States of America (about 59.9%), followed by Japan (about 6.2%) and the United Kingdom (about 3.9%).
Dec 31, 2023
% complete
The total market capitalization of all publicly traded stocks worldwide rose from US$2.5 trillion in 1980 to US$111 trillion by the end of 2023, reflecting decades of extraordinary growth in global equity markets.
Or browse the full history timeline directory, with more than 2,000 topics.
This History of the Stock Market timeline was generated with the help of AI, using information found on the internet.
We work hard to keep these timelines accurate, but mistakes do get through. If you spot one, email us at [email protected] and we'll fix it for future visitors.
Generate yours with AI or build it from scratch, for free.
Export your timeline, add your own events, edit or remove AI-generated events, and much more
No credit card required.
Cancel anytime.
Cancel anytime.
You can create an unlimited number of timelines with up to 10 events on each one, customize how they look, export them to PDF, PNG, PowerPoint, CSV, and Excel, and share them with a link. Paid plans raise the event limit and add features like spreadsheet imports and collaborators.
Yes. You can cancel your subscription from your account page at any time, and you will not be charged again. Your subscription stays active for the rest of the period you already paid for.
Yes. We will email you a reminder before the annual renewal, and we will also email you a receipt.
Yes. You can email us within 15 days of any payment, and we will issue you a full refund.
Check out our pricing docs or send us an email anytime: [email protected].