-
Use Cases
-
Resources
-
Pricing
The history of statistics traces humanity's efforts to collect, analyze, and interpret data, beginning with ancient censuses and state record-keeping. It evolved through the development of probability theory in the 17th century, the founding of modern statistical methods by figures like Gauss, Laplace, Galton, Pearson, and Fisher, and continues today with computational statistics and big data analytics driving advances across science, business, and society. More Less
1654
% complete
In a famous exchange of letters, Blaise Pascal and Pierre de Fermat solved the problem of points, establishing foundational principles of probability theory while analyzing gambling problems posed by the Chevalier de Méré.
Image source: Blaise Pascal
1657
% complete
Dutch scientist Christiaan Huygens published 'De Ratiociniis in Ludo Aleae', the first published treatise on probability theory, systematizing the ideas emerging from the Pascal-Fermat correspondence.
Image source: Christiaan Huygens
1713
% complete
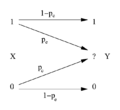
Jacob Bernoulli's posthumously published 'Ars Conjectandi' introduced the law of large numbers, showing that sample frequencies converge to true probabilities as sample size grows, a foundational result for statistical inference.
Image source: Law of large numbers
1733
% complete
Abraham de Moivre derived the normal curve as an approximation to the binomial distribution in his work on chance, later expanded in 'The Doctrine of Chances'. His discovery anticipated the central limit theorem by over a century.
Image source: Abraham de Moivre
1763
% complete
Richard Price presented Thomas Bayes' essay on inverse probability to the Royal Society two years after Bayes' death. Bayes' theorem provided a mathematical framework for updating beliefs with evidence, founding Bayesian statistics.
1774
% complete
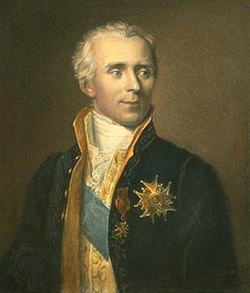
Pierre-Simon Laplace advanced probability theory enormously, developing Bayesian-style inference, the central limit theorem, and applying probabilistic methods to astronomy and legal questions across several decades.
Image source: Pierre-Simon Laplace
1933
% complete
Soviet mathematician Andrey Kolmogorov published his axioms of probability based on measure theory, placing probability on a rigorous mathematical foundation and enabling modern stochastic process theory.
Image source: Andrey Kolmogorov
1662
% complete
John Graunt analyzed the Bills of Mortality in London to produce the first systematic study of demographic data. His work on life tables laid the groundwork for demography and is often considered the birth of statistics as a discipline.
Image source: John Graunt
1693
% complete
Astronomer Edmund Halley published an analysis of mortality data from Breslau, constructing a life table used to price annuities. His work became a cornerstone of actuarial science.
Image source: Edmond Halley
1835
% complete
Belgian astronomer Adolphe Quetelet published 'Sur l'homme', applying statistical methods to human characteristics and social behavior. He introduced the concept of the 'average man' and helped establish social physics.
Image source: Adolphe Quetelet
1858
% complete
Florence Nightingale pioneered the use of statistical graphics, including polar area diagrams, to demonstrate that most Crimean War deaths were preventable. Her advocacy led to major public health reforms and she became the first female fellow of the Royal Statistical Society.
Image source: Florence Nightingale
1866
% complete
Gregor Mendel published his experiments on pea plant inheritance, using careful quantitative analysis to deduce the laws of heredity. His statistically rigorous approach was largely ignored until its rediscovery in 1900.
Image source: Gregor Mendel
1795
% complete
Carl Friedrich Gauss developed the method of least squares as a teenager, though Legendre published it first in 1805. Gauss connected it to the normal distribution and used it to predict the orbit of the asteroid Ceres.
Image source: Least squares
1886
% complete
Francis Galton introduced the concepts of correlation and regression to the mean through his studies of heredity, providing tools to measure relationships between variables that remain central to statistics today.
Image source: Francis Galton
1892
% complete
Karl Pearson systematized correlation theory, developed the chi-squared test (1900), founded the journal Biometrika, and established the world's first university statistics department at University College London in 1911.
Image source: Karl Pearson
1908
% complete
Working at Guinness Brewery, William Sealy Gosset developed the t-distribution and t-test for small samples, publishing under the pseudonym 'Student'. His work enabled quality control and small-sample inference in industry.
Image source: Student's t-test
1925
% complete
Ronald Fisher's influential textbook made rigorous statistical methods accessible to scientists, popularizing significance testing, maximum likelihood estimation, and analysis of variance across experimental sciences.
Image source: Statistical Methods for Research Workers
1933
% complete
Jerzy Neyman and Egon Pearson formalized hypothesis testing with concepts of Type I and Type II errors, statistical power, and confidence intervals, creating the frequentist decision-theoretic framework still widely taught today.
1946 - 1948
% complete
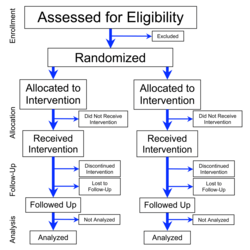
The Medical Research Council's trial of streptomycin for tuberculosis, designed with Austin Bradford Hill, was among the first randomized controlled trials, revolutionizing how medical treatments are evaluated.
Image source: Randomized controlled trial
1972
% complete
David Cox published the proportional hazards model, allowing researchers to analyze survival data without specifying the underlying hazard distribution. It became one of the most cited papers in statistics and essential in medical research.
1948
% complete
Claude Shannon's 'A Mathematical Theory of Communication' introduced entropy and information measures, providing a statistical foundation for communication systems and deeply influencing machine learning and statistics.
Image source: Information theory
1977
% complete
John Tukey's book 'Exploratory Data Analysis' promoted visual and computational techniques like box plots and stem-and-leaf displays, shifting emphasis toward flexible data exploration rather than rigid confirmatory testing.
Image source: Exploratory data analysis
1979
% complete
Bradley Efron introduced the bootstrap, a computationally intensive resampling technique for estimating uncertainty without parametric assumptions. It exemplified the growing power of computation in statistical practice.
Image source: Bootstrapping (statistics)
1990
% complete
Following the Gibbs sampler paper by Gelfand and Smith, Markov chain Monte Carlo methods spread rapidly, making complex Bayesian models computationally feasible and fueling a renaissance of Bayesian statistics in the 1990s.
1995
% complete
Ross Ihaka and Robert Gentleman released R, an open-source implementation of the S language, at the University of Auckland. R became the dominant platform for statistical computing and graphics worldwide.
Image source: R (programming language)
1995
% complete
Corinna Cortes and Vladimir Vapnik published their influential paper on support vector machines, bridging statistical learning theory and practical classification, and helping launch the modern intersection of statistics and machine learning.
Image source: Support vector machine
2001
% complete
Leo Breiman introduced Random Forests, an ensemble method combining many decision trees, which became one of the most widely used algorithms for prediction and highlighted the shift toward algorithmic modeling in statistics.
Image source: Random forest
2004
% complete
Google engineers Jeffrey Dean and Sanjay Ghemawat published MapReduce, a framework for distributed processing of massive datasets. It catalyzed big data analytics and new statistical approaches to enormous datasets.
2012
% complete
AlexNet's victory in the ImageNet competition demonstrated the power of deep neural networks, accelerating the integration of machine learning into statistics and driving new research areas such as statistical deep learning theory and uncertainty quantification.
Image source: Deep learning
Or browse the full history timeline directory, with more than 2,000 topics.
This History of Statistics timeline was generated with the help of AI, using information found on the internet.
We work hard to keep these timelines accurate, but mistakes do get through. If you spot one, email us at [email protected] and we'll fix it for future visitors.
Generate yours with AI or build it from scratch, for free.
Export your timeline, add your own events, edit or remove AI-generated events, and much more
No credit card required.
Cancel anytime.
Cancel anytime.
You can create an unlimited number of timelines with up to 10 events on each one, customize how they look, export them to PDF, PNG, PowerPoint, CSV, and Excel, and share them with a link. Paid plans raise the event limit and add features like spreadsheet imports and collaborators.
Yes. You can cancel your subscription from your account page at any time, and you will not be charged again. Your subscription stays active for the rest of the period you already paid for.
Yes. We will email you a reminder before the annual renewal, and we will also email you a receipt.
Yes. You can email us within 15 days of any payment, and we will issue you a full refund.
Check out our pricing docs or send us an email anytime: [email protected].